

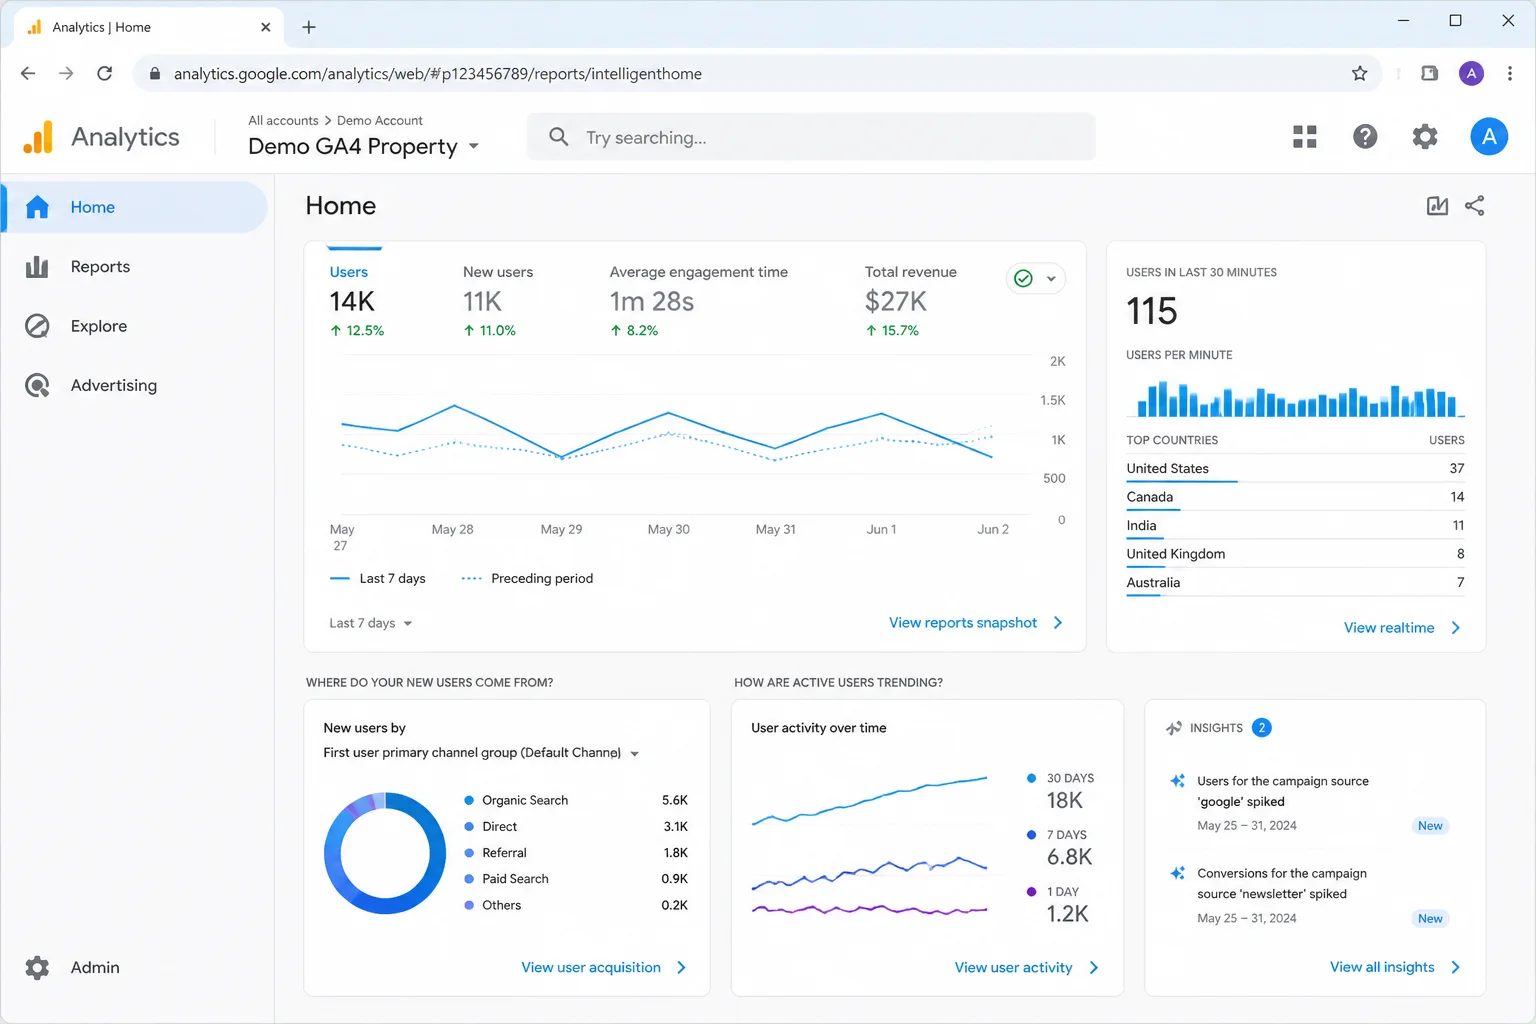
If you’ve opened Google Analytics hoping to finally understand your site traffic, and then gotten completely lost staring at columns you don’t recognize, you’re not alone. GA4 (Google Analytics 4) is the current version of Google Analytics, and it uses the words “dimension” and “metric” constantly. Most explanations just swap those words for other jargon. Not great.
Short version: dimensions describe what you’re looking at (like which page, which country, or which device). Metrics tell you how much of it there is (like how many sessions or how many key events). By the end of this guide, you’ll know exactly what they mean, where to find them in GA4, and how to pull the specific data you actually care about.
What Is a Dimension in Google Analytics 4?
A dimension is an attribute, a descriptive label that answers the “who, what, where, or how” questions about your data. It’s the thing you’re grouping or slicing by.
Some common GA4 dimensions:
- Page location: the specific URL a visitor landed on
- Session default channel group: how visitors found you (Organic Search, Direct, Paid Social, Referral, etc.)
- Device category: Desktop, Mobile, or Tablet
- Country: where the visitor was located
- Event name: what action fired (page_view, scroll, purchase, etc.)
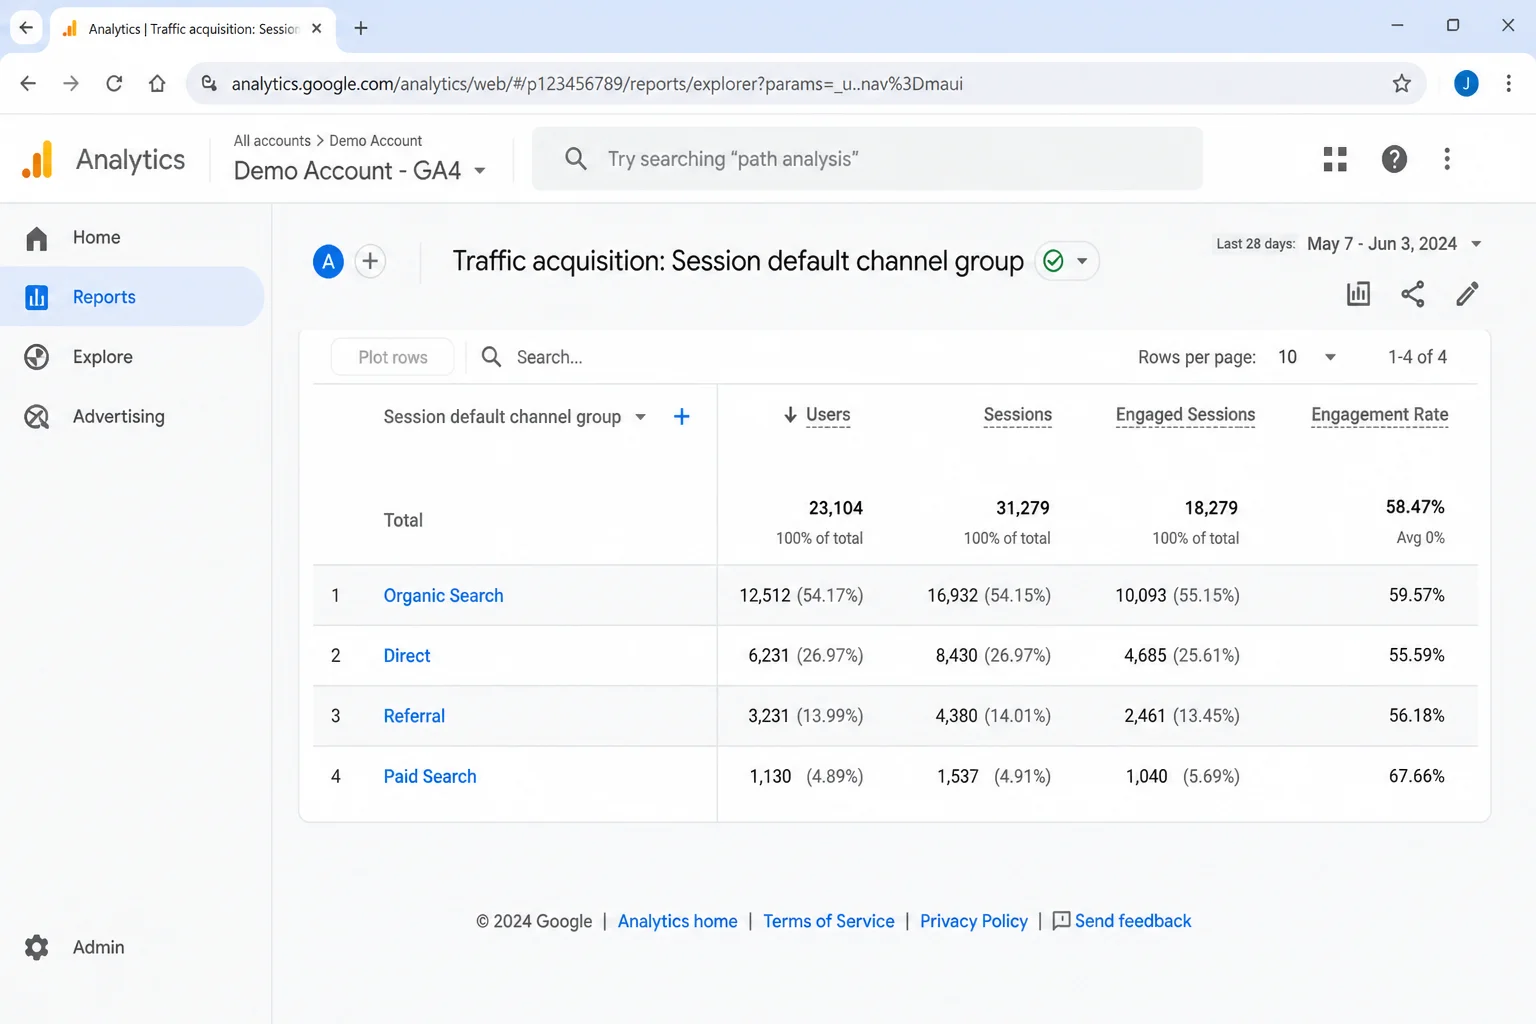
In any GA4 report table, the first column on the left is your dimension. It defines each row.
One thing that trips people up: dimensions can sometimes look like numbers (a session ID, for instance, is technically a number), but GA4 can’t do math on them. You can’t sum your page URLs or average your country names. They’re labels: the thing you’re measuring across, not the measurement itself.
What Is a Metric in Google Analytics 4?
A metric is a number. Always. It’s a quantitative measurement: something GA4 can add up, average, or turn into a ratio. If you can apply math to it, it’s a metric.
Common GA4 metrics include:
- Users: how many people visited
- Sessions: how many separate visits happened
- Views: how many pages or screens were loaded
- Engagement rate: the percentage of sessions that lasted longer than 10 seconds, included a key event, or had at least two page or screen views
- Event count: how many times a specific action fired
- Key events: how many times an event you marked as important was completed
- Total revenue: money from purchases
In that same report table, the columns to the right of your dimension are your metrics. Always numbers. Always something you can compare and track over time.
How Dimensions and Metrics Work Together
What makes this click: a dimension without a metric is just a list. A metric without a dimension is just one big total. You need both to get anything useful.
Think of it like a spreadsheet. The dimension is the left column, the thing you’re grouping by. The metrics are the number columns to the right: what you’re measuring for each group.
A few real examples:
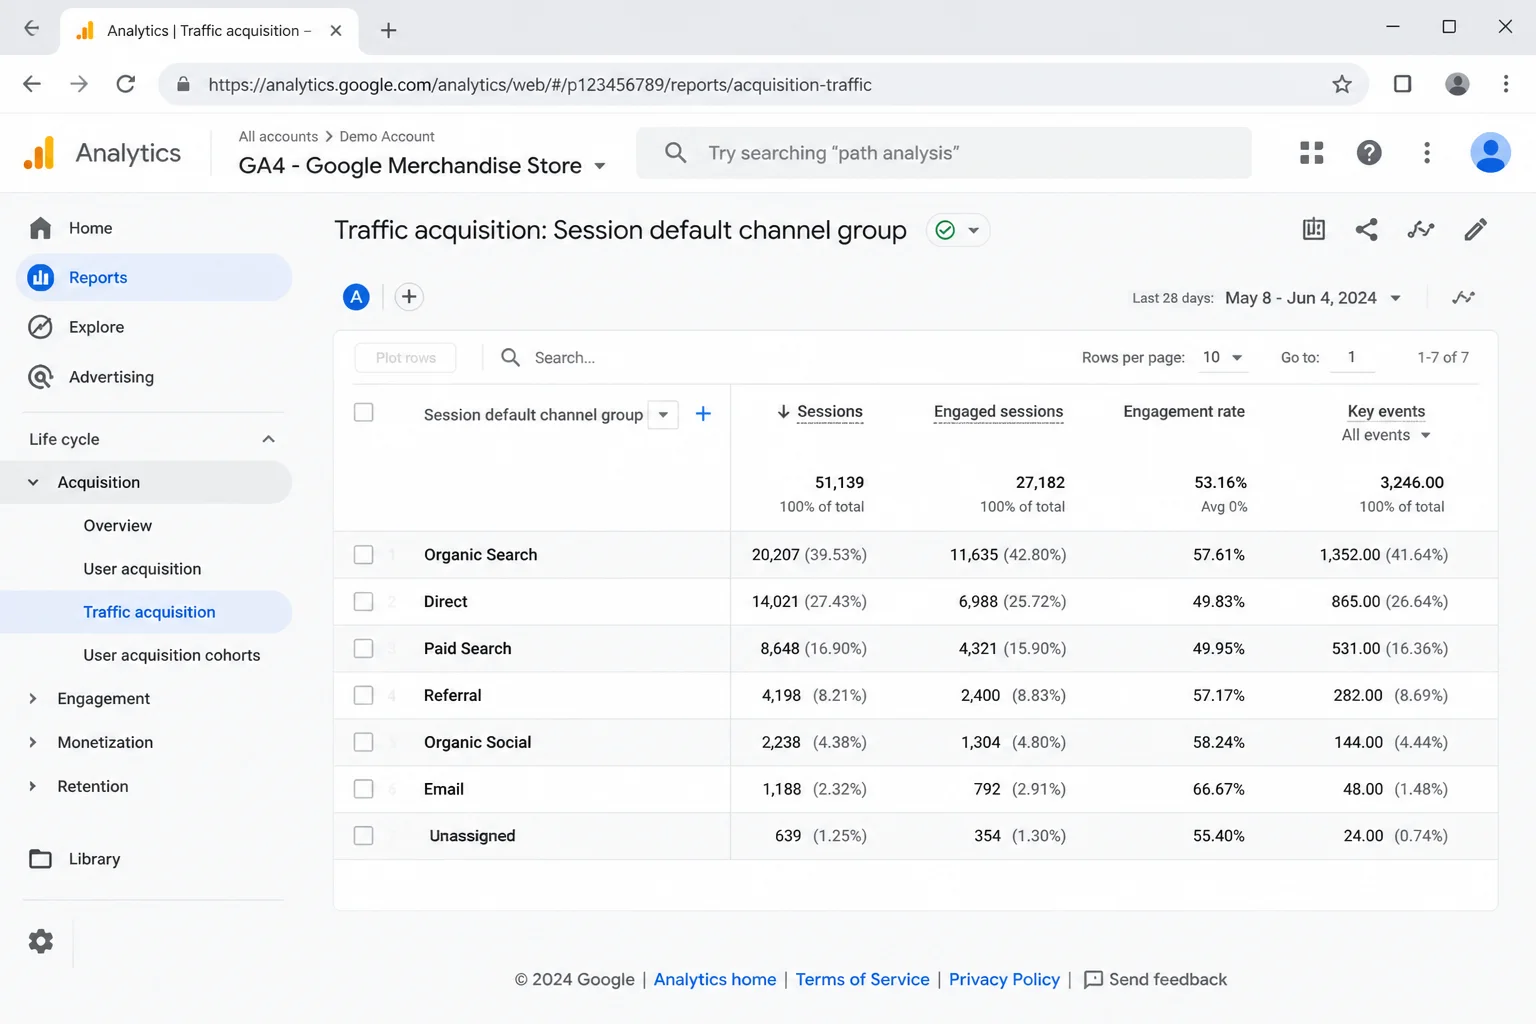
- Sessions by Session default channel group: you’d see Organic Search, Direct, Paid Social, etc. on the left, with session counts on the right. That tells you exactly where your traffic is coming from.
- Key events by Device category: Desktop, Mobile, Tablet on the left, with key event counts on the right. If mobile completes key events at a fraction of the desktop rate, that’s a specific problem you can actually fix.
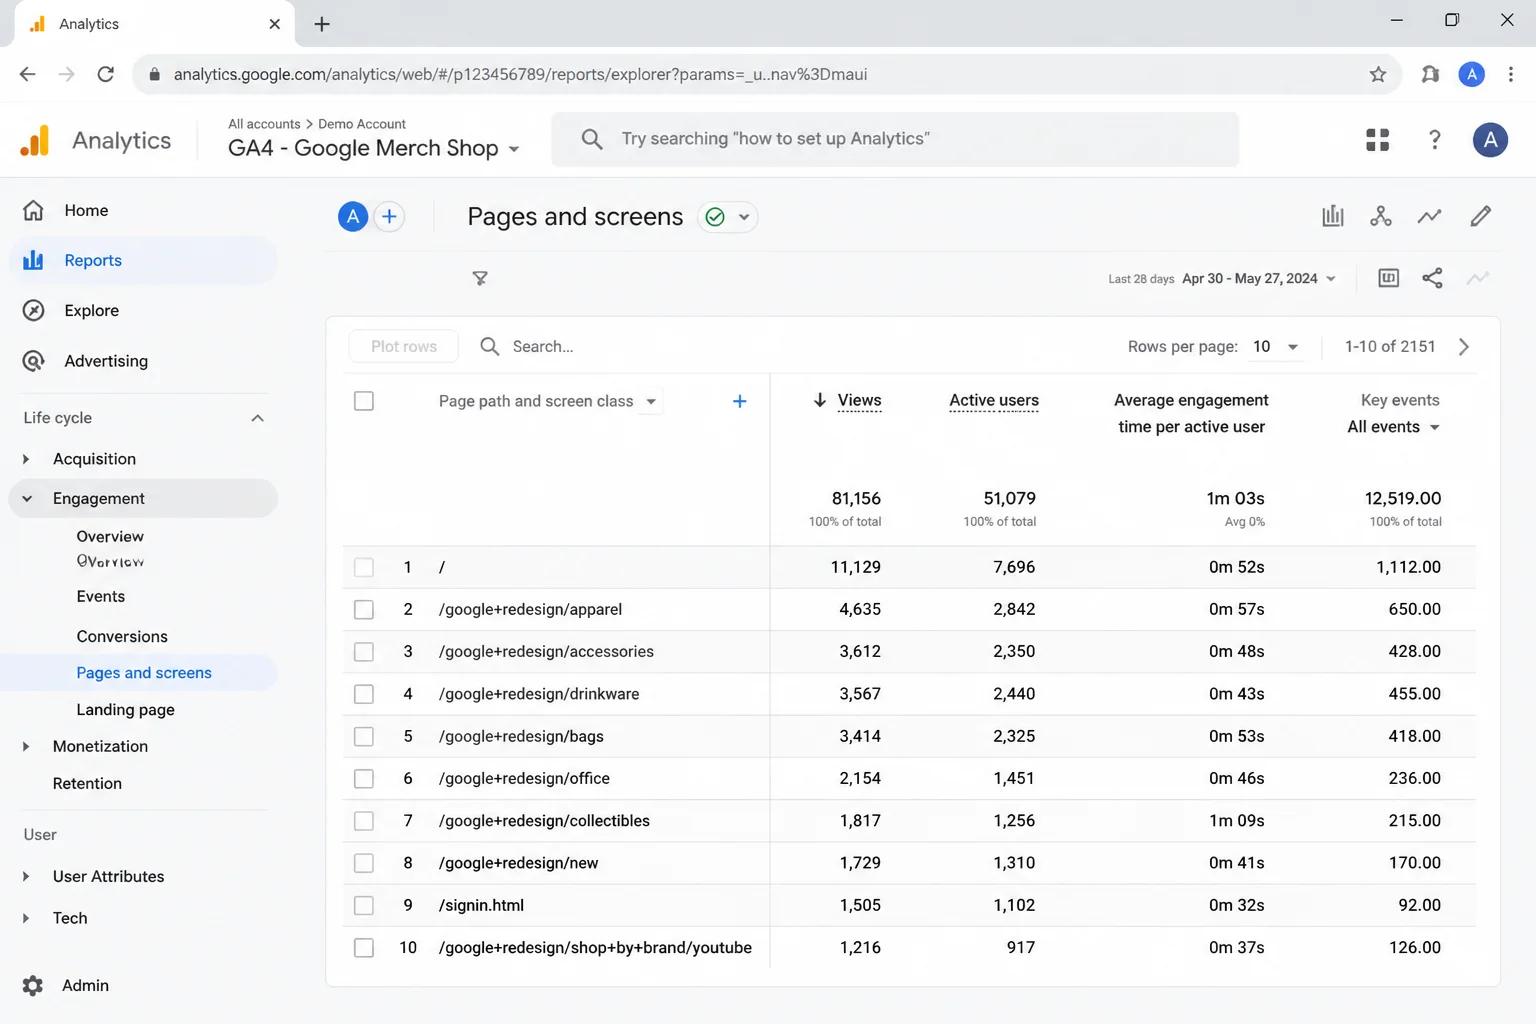
- Views by Page location: shows which specific pages get the most traffic.
The dimension defines the breakdown. The metrics show the numbers for each row in it.
How to Find and Change Dimensions in GA4 Reports
GA4’s standard reports already have dimensions and metrics built in. You don’t have to build everything from scratch to get useful data.
Step 1: Open a Report
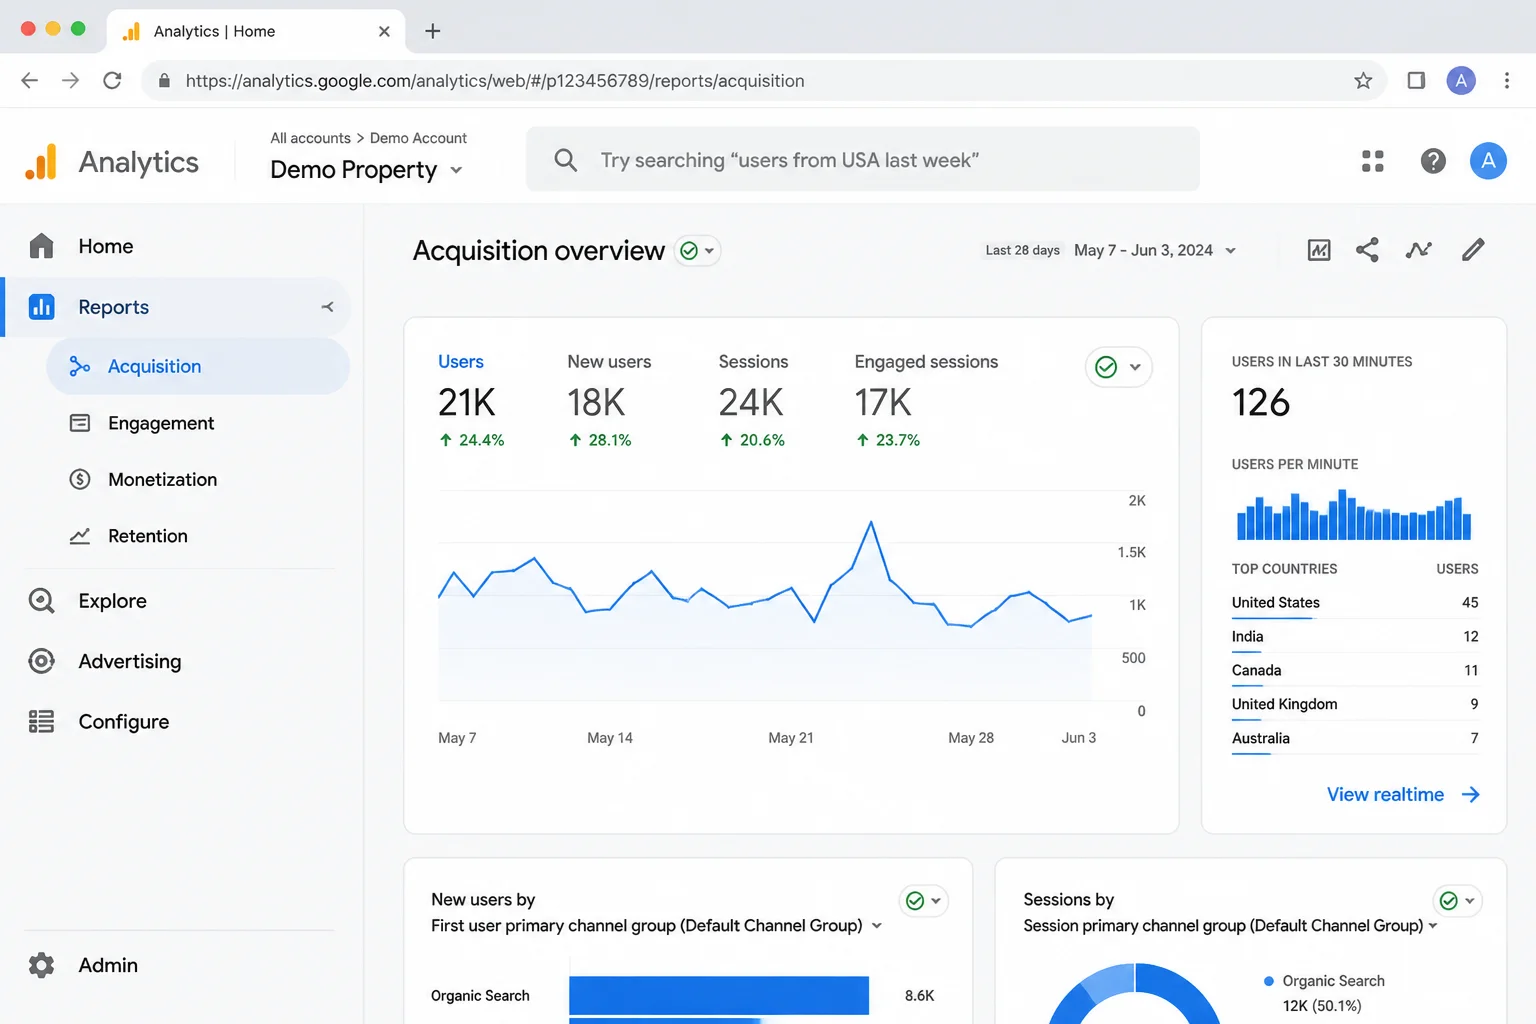
Log in at analytics.google.com and select your property. In the left sidebar, click Reports, then pick a section:
- Acquisition: traffic sources, channels, campaigns
- Engagement: pages, events, user behavior
- Monetization: ecommerce and revenue
Step 2: Read the Report Table
Scroll down past the charts to the data table. The left column is your active dimension. The numbered columns to the right are your metrics.
Step 3: Switch the Dimension
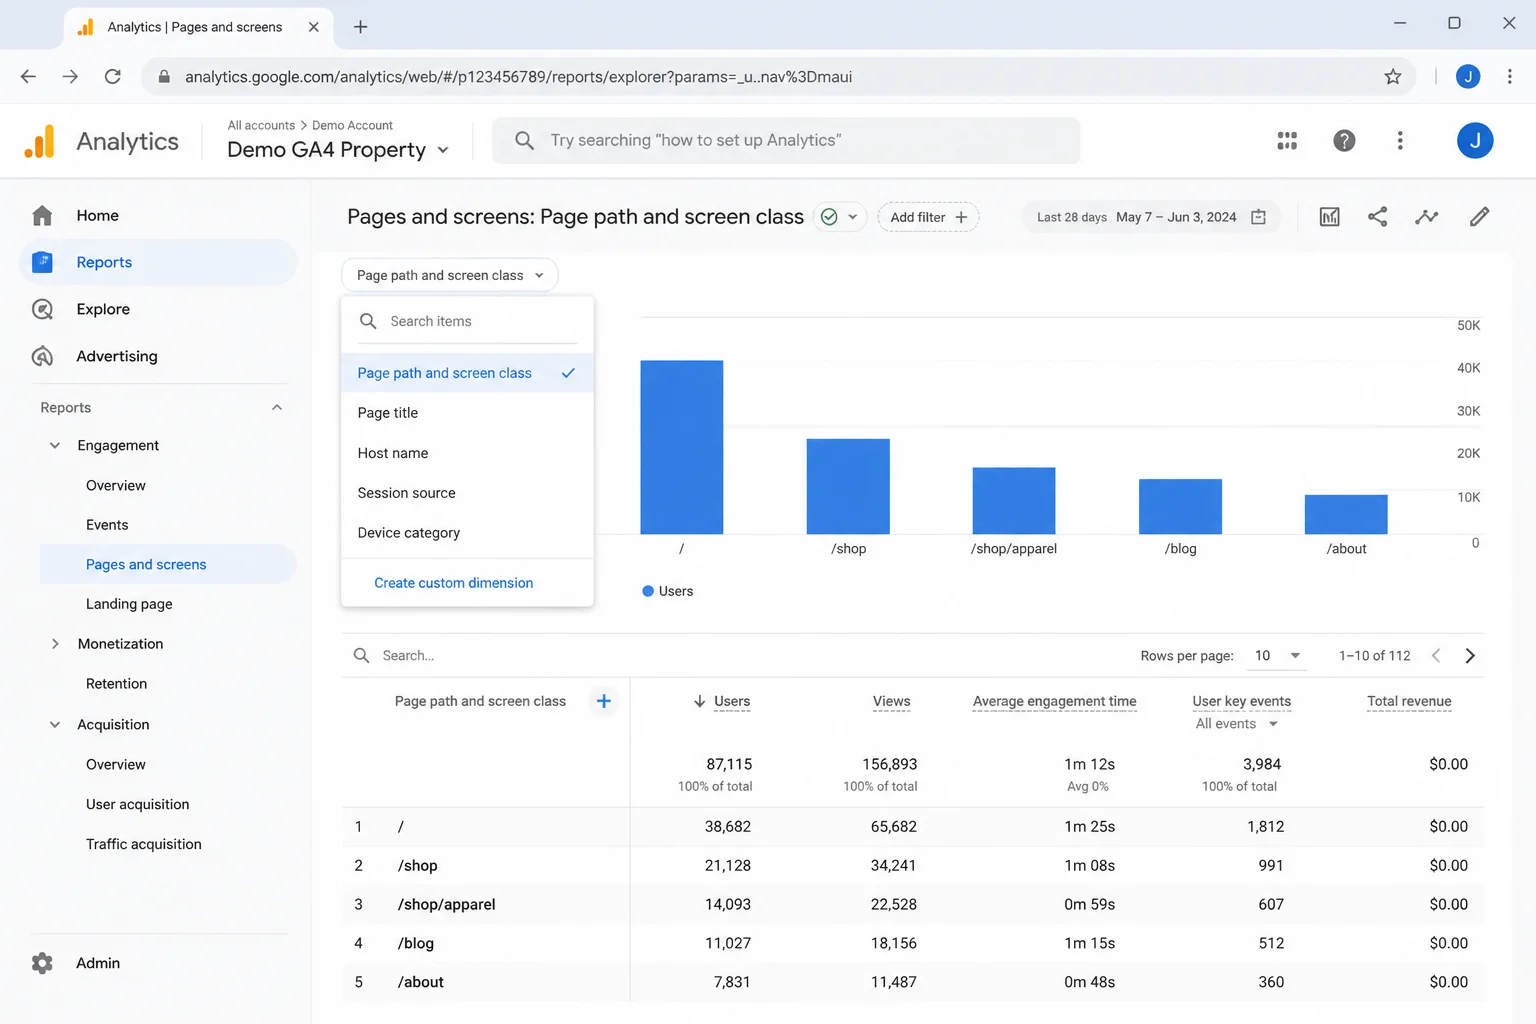
At the top of the table, you’ll see the current dimension name, something like “Session default channel group” or “Page path and screen class.” Click on it to open a dropdown of other available dimensions.
For example, in Reports > Engagement > Pages and screens, you can switch from Page path and screen class to:
- Page title
- Host name
- Session source
- Device category
Step 4: Sort by a Metric
Click any metric column header to sort the table by that column. It’s the fastest way to find your highest-traffic pages or your most-triggered events without building a custom report.
Building Custom Explorations in GA4
Standard reports cover the common use cases well. When you want to mix your own dimensions and metrics (say, social network traffic broken down by device type), GA4’s Explore section is where you’ll do that.
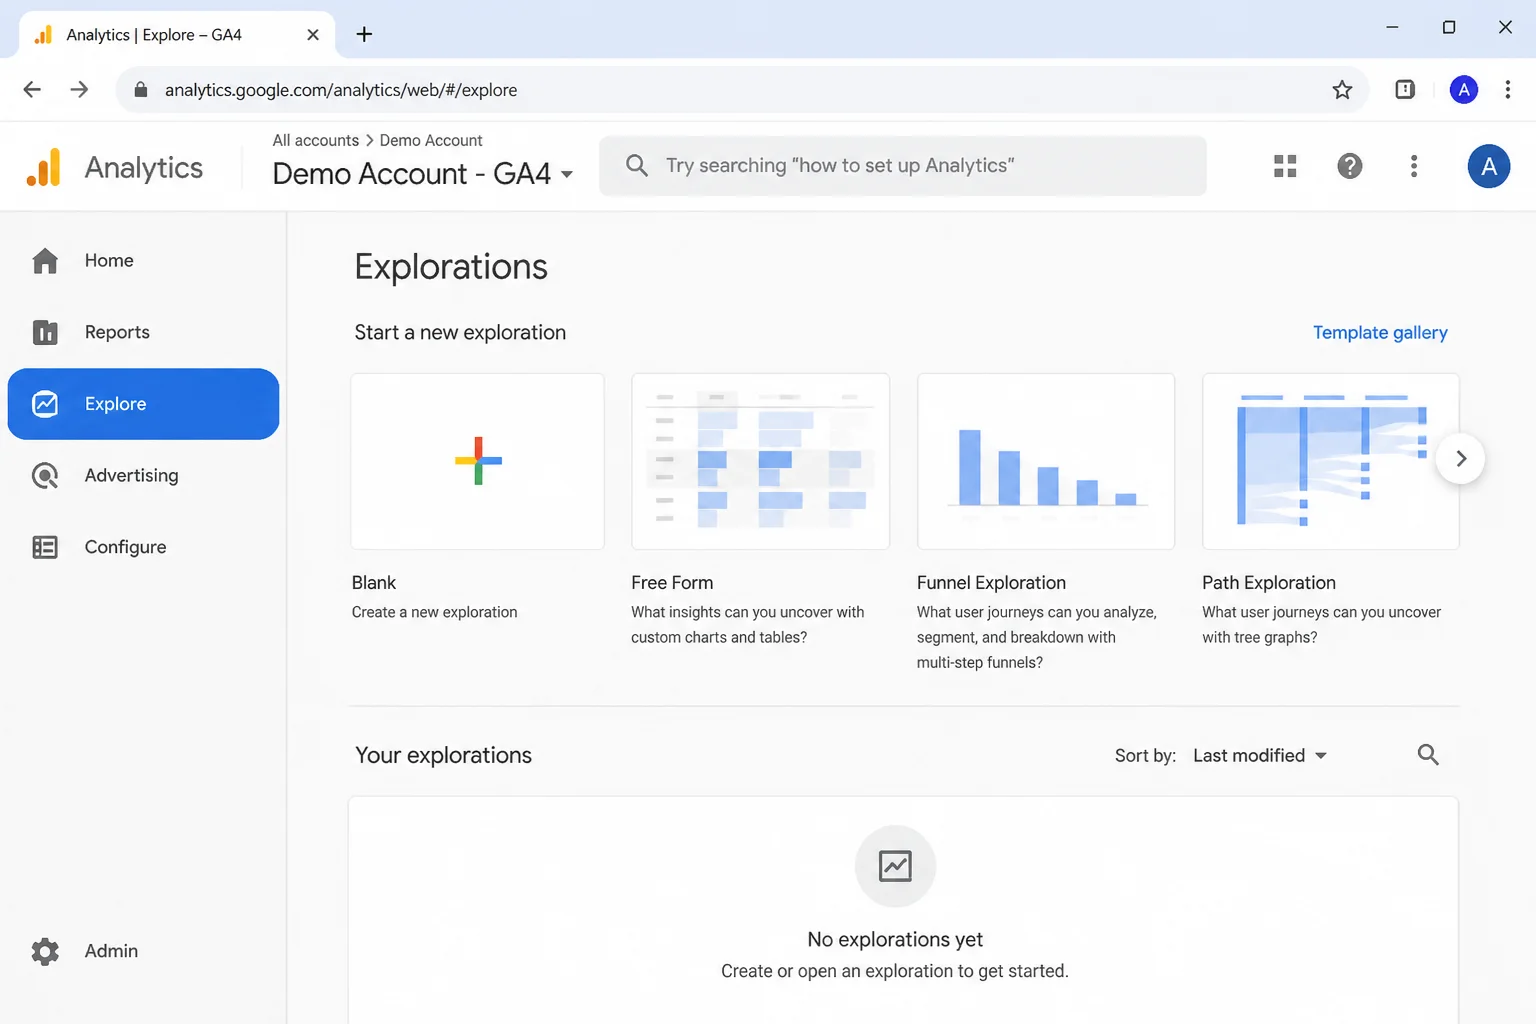
Step 1: Open Explore
In the left sidebar, click Explore.
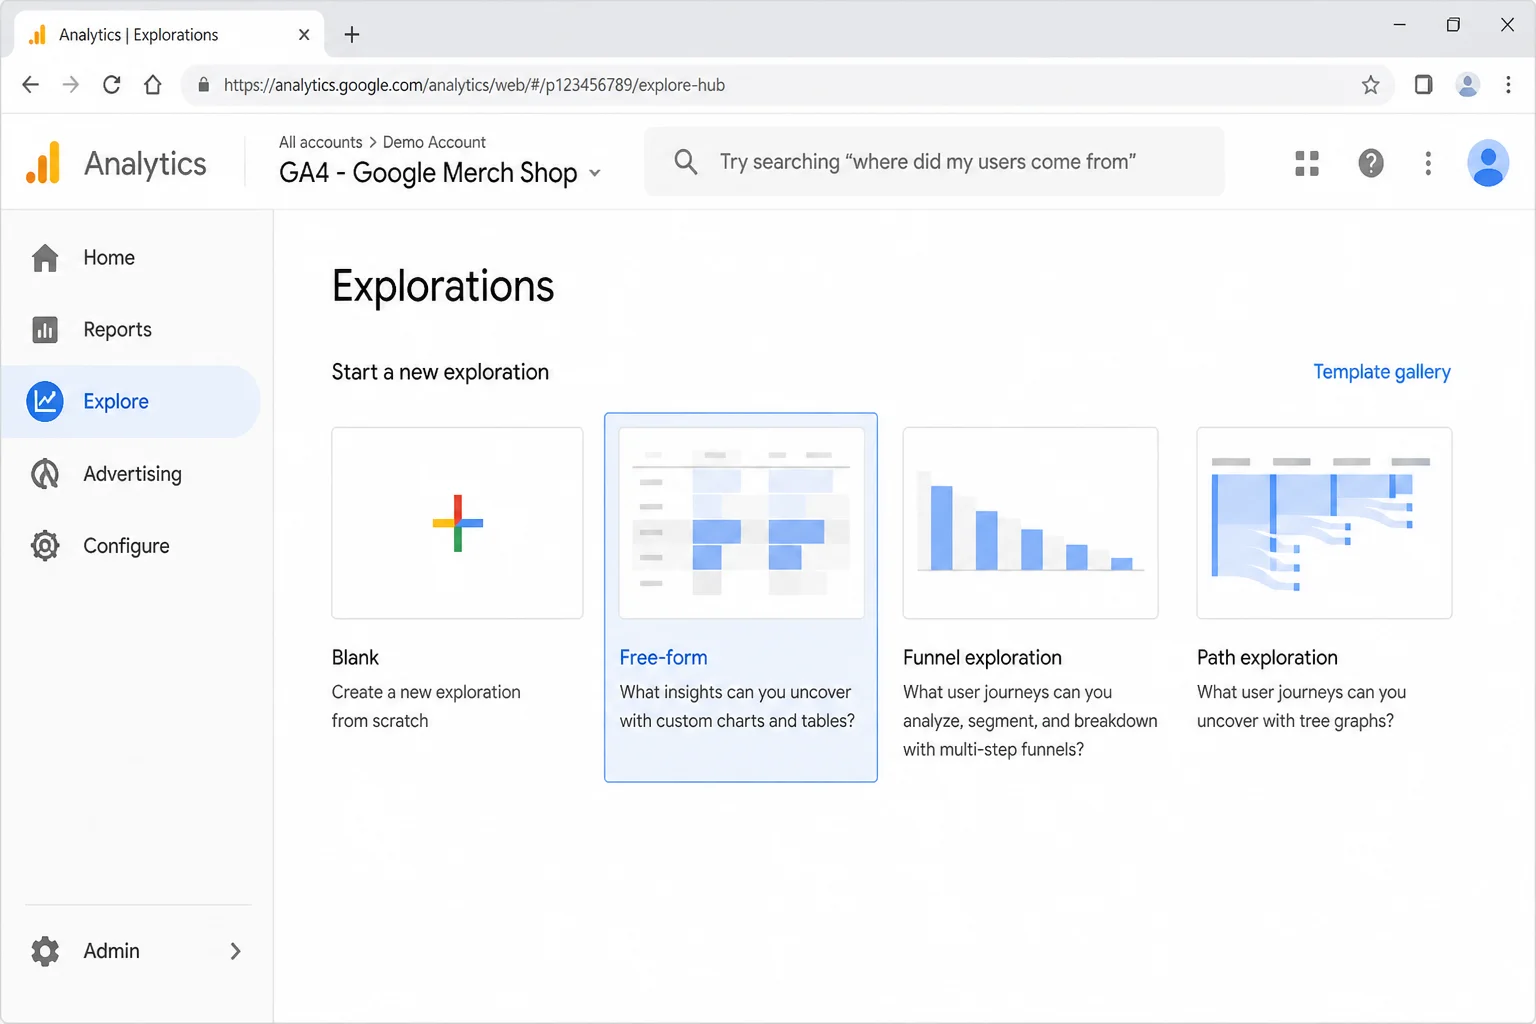
Step 2: Start a Free-Form Exploration
Click Blank to start from scratch, or choose Free-form exploration from the template list. Free-form is the most flexible option for building a custom dimension + metric view.
Step 3: Add Dimensions and Metrics
In the Variables panel on the left, you’ll see separate sections for Dimensions and Metrics. Click the + next to each to pick what you want to work with.
For a social traffic exploration, you’d add:
- Dimension: Session default channel group (or Session source for specific sites)
- Metrics: Sessions, Users, Key events
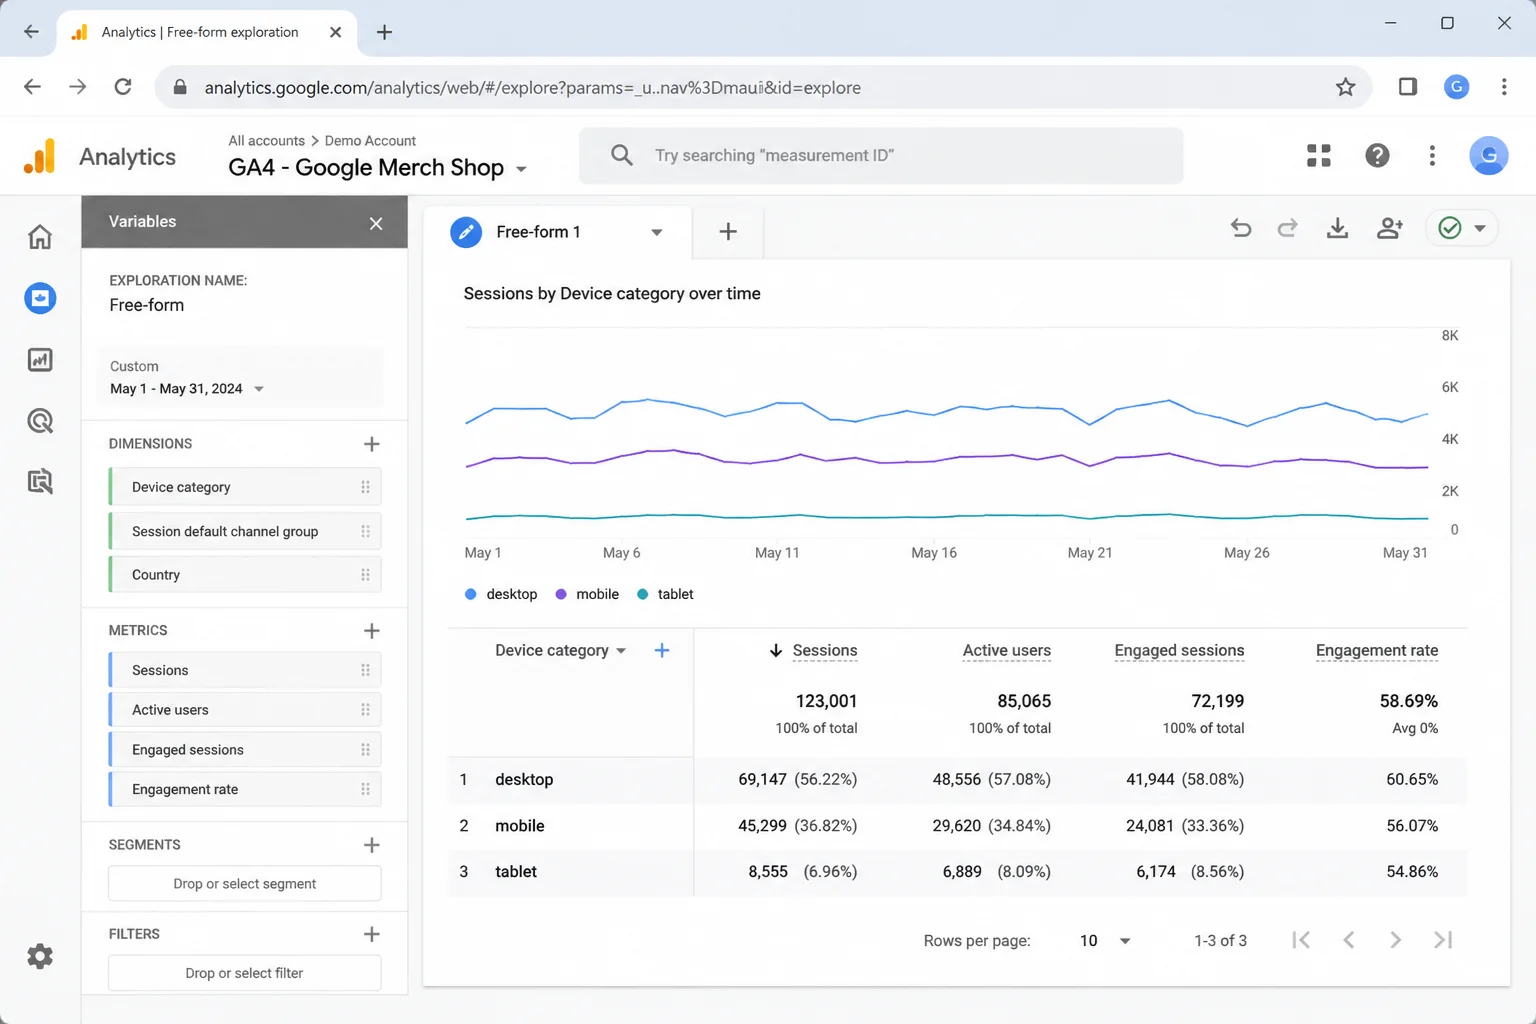
Step 4: Build the Table
Drag your dimension into the Rows box and your metrics into the Values box in the Tab Settings panel on the right. GA4 builds the table as you drop things in.
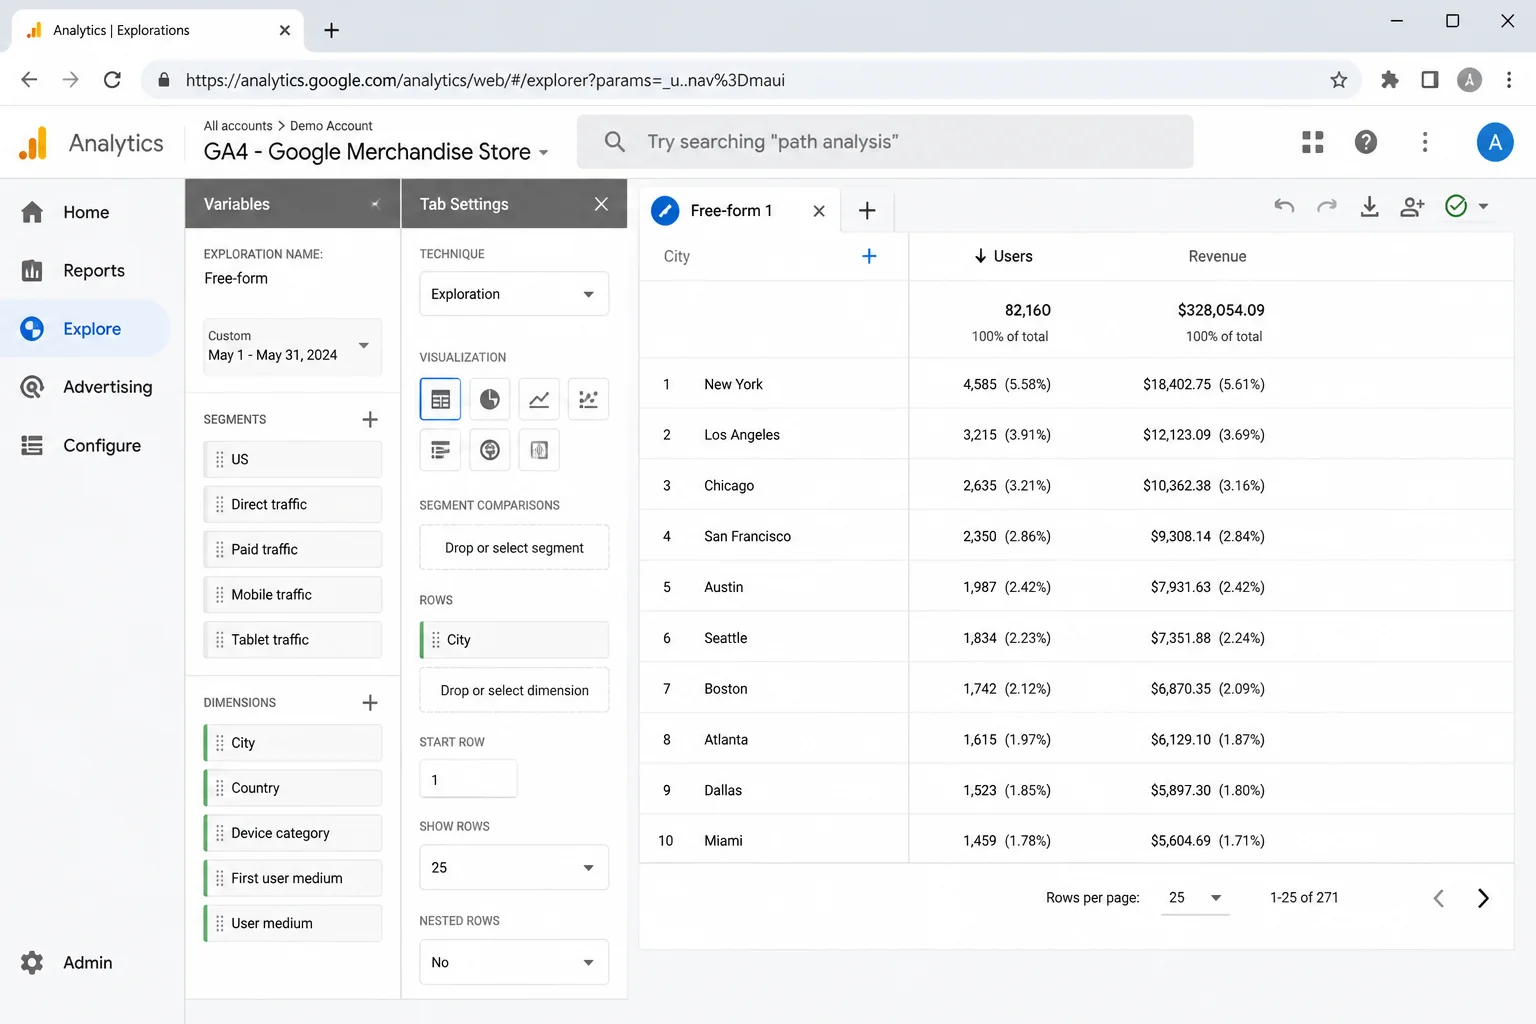
Step 5: Filter Out What You Don’t Need
In the Tab Settings panel, scroll down to Filters. Click Add filter to exclude (or include only) specific dimension values. To exclude Direct traffic from a channel comparison, for example, you’d set a filter condition on Session default channel group.
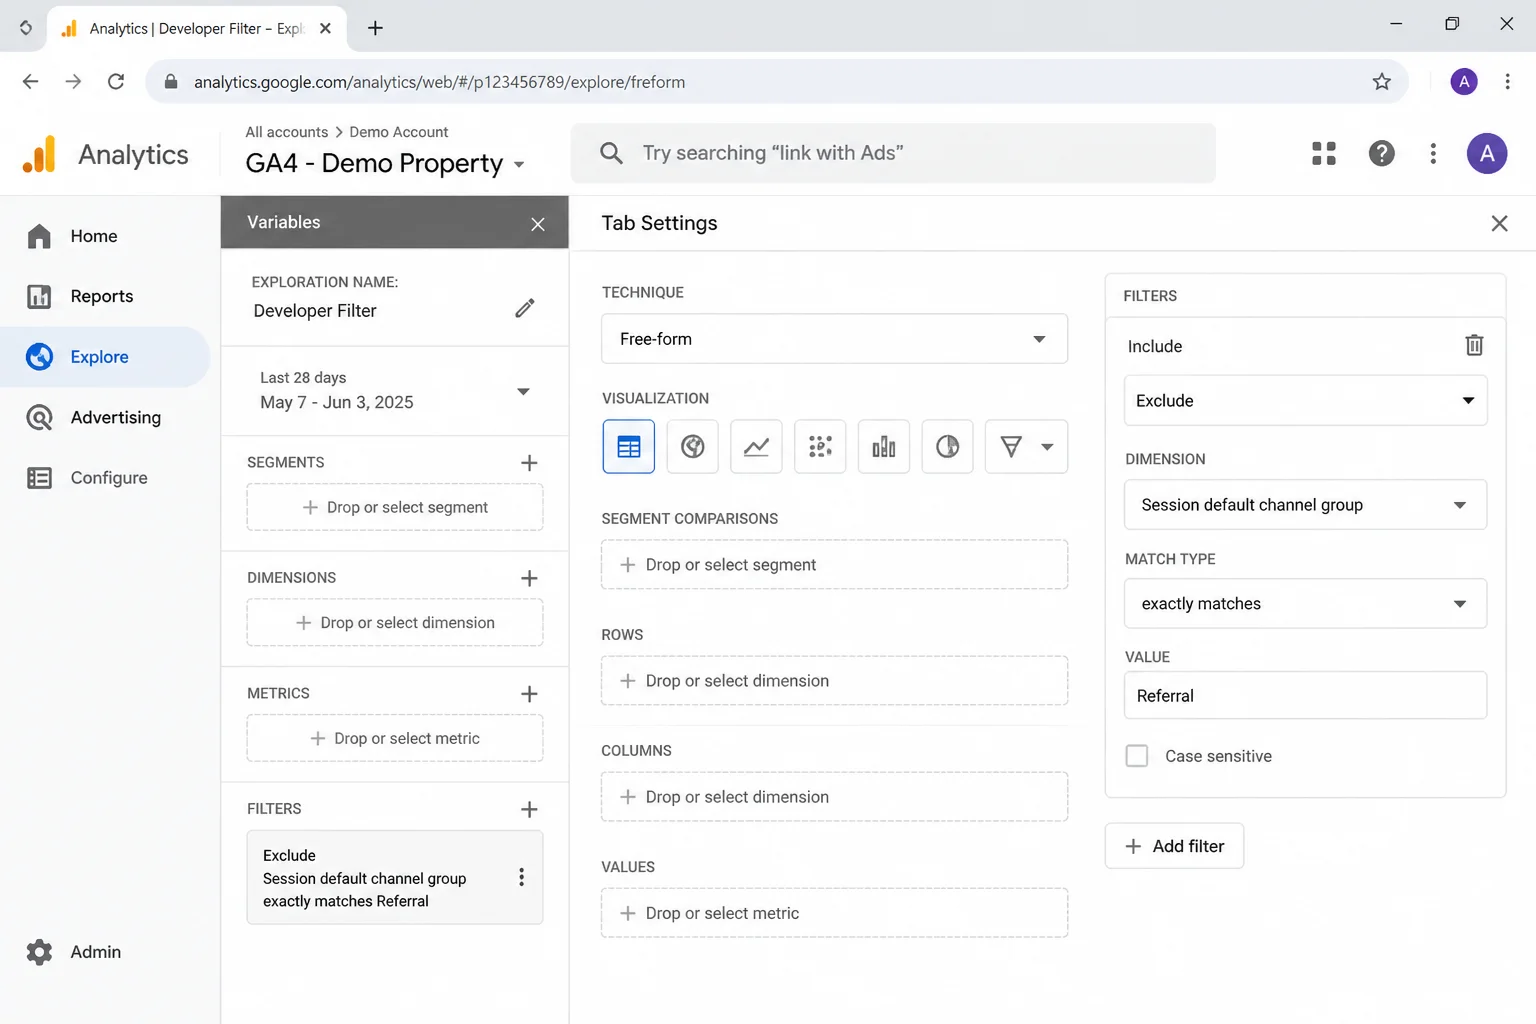
Custom Dimensions in GA4
GA4 lets you create dimensions based on data your own site or app sends, things like content category, membership tier, or article author. These are called custom dimensions, and they’re available once you register an event parameter as one in GA4’s admin settings.
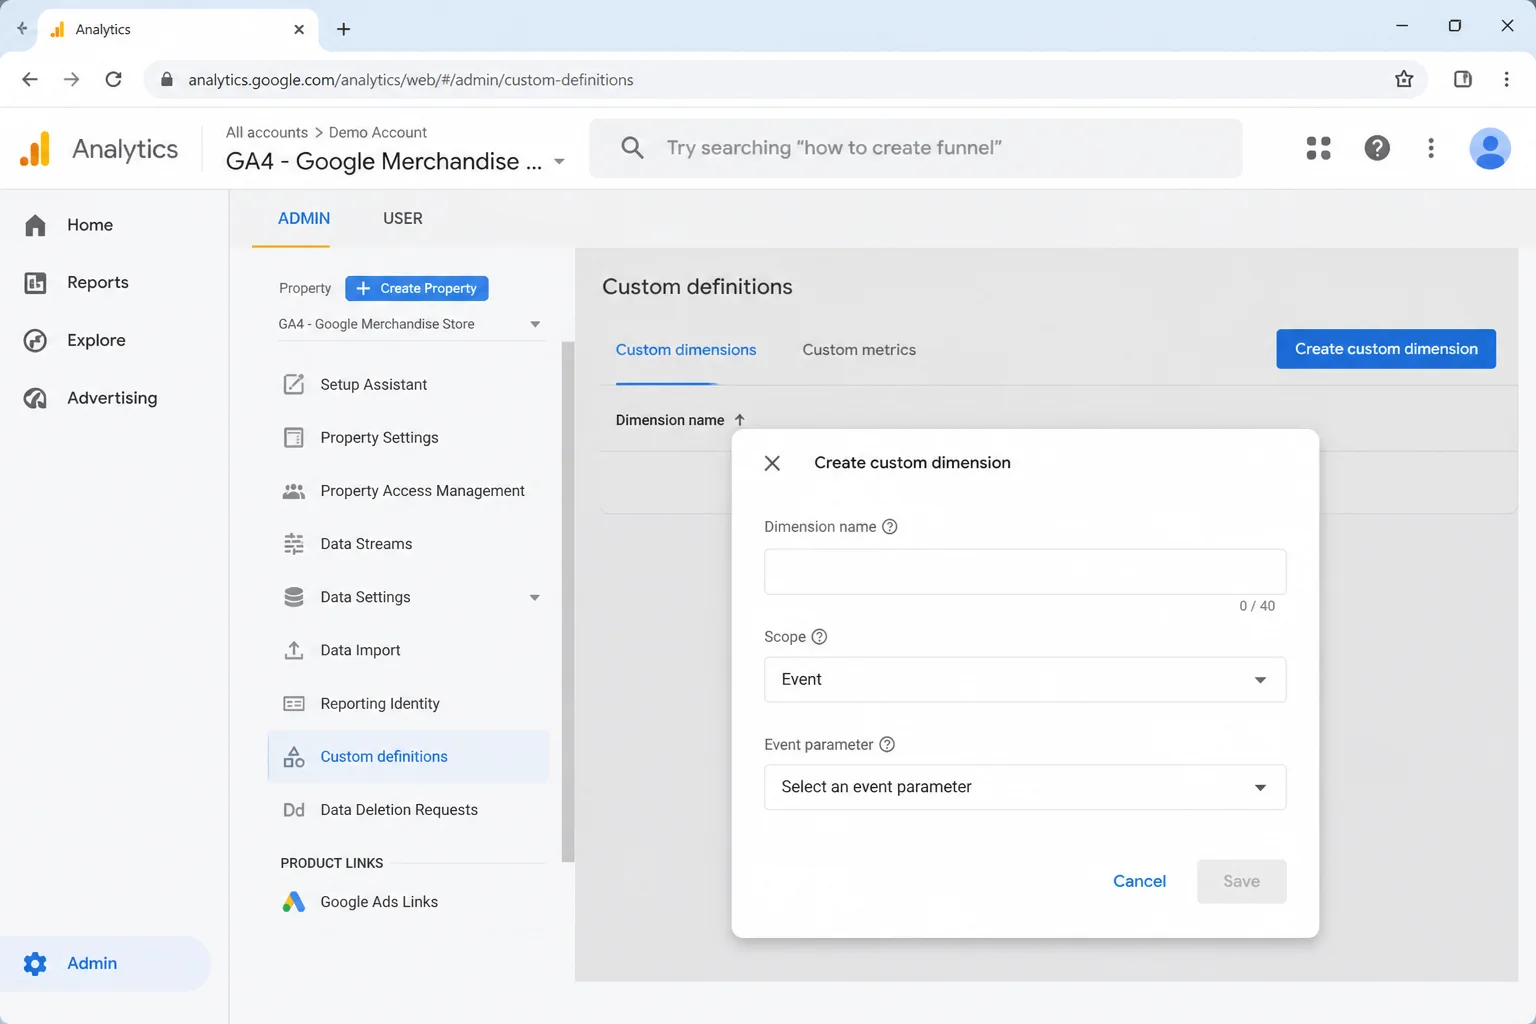
How to Create a Custom Dimension
- In GA4, click the Admin gear icon at the bottom left.
- Under the Property column, click Custom definitions.
- Click Create custom dimension.
- Fill in the fields:
– Dimension name: a human-readable label (e.g., “Content Category”)
– Scope: choose Event if the dimension describes a specific action, or User if it describes the person across multiple sessions
– Event parameter: the exact parameter name your tags or SDK send (e.g., content_category)
- Click Save.
A few things to know before expecting data to appear:
- It’s not retroactive. GA4 only starts collecting values for a custom dimension from the moment you register it. Past events won’t show any data, even if they included the parameter.
- The parameter name must match exactly. If your tag sends
ContentCategorybut you registeredcontent_category, the dimension stays empty. Case and underscores matter, so check them character by character. - There’s a quota. Each GA4 property has a limit on how many custom dimensions you can register, so focus on the ones that actually drive decisions for your business.
Tips and Troubleshooting
Common Issues
My custom dimension keeps showing “(not set)”
This almost always means the parameter name doesn’t match. Compare the exact spelling in your tag or SDK against what you registered in Custom definitions, character by character. It’s more often a case mismatch (contentCategory vs content_category) than a missing event altogether.
I can’t find Bounce Rate in GA4
GA4 tracks engagement rate instead: the percentage of sessions that lasted longer than 10 seconds, included a key event, or had at least two page or screen views. You can add it as a metric when customizing Acquisition and Engagement reports. It’s a more useful signal anyway, since a one-page visit where someone spent five minutes reading doesn’t register as disengaged anymore.
My GA4 looks nothing like the screenshots I’ve seen online
A lot of tutorials online show Universal Analytics (UA), which has completely different navigation menus (Behavior, Audience, Acquisition arranged differently) that don’t exist in GA4. If your left sidebar shows Reports, Explore, and Advertising, you’re in GA4 and you’re in the right place.
Pro Tips
- Quick mental rule: if GA4 can do math on it (sum, average, ratio), it’s a metric. If it describes what/where/who, it’s a dimension.
- Pair them with purpose. Knowing your overall key event rate is fine. Knowing the key event rate by device category tells you whether you have a mobile problem, and that’s actually fixable.
- Bookmark the official reference. Google’s Analytics dimensions and metrics reference lists every GA4 dimension and metric with its exact name and what it measures. Worth having open when you’re building anything custom. You can also find more information on GA4 dimensions and metrics on Digital Applied and Analytics Mates.
Wrapping Up
Once you’ve got the mental model (dimensions on the left, metrics on the right), GA4’s reports finally start making sense. Start with the standard Acquisition and Engagement reports to get comfortable, then move to Explore when you want to answer something more specific.
If custom dimensions are showing “(not set)” after you’ve set them up, a parameter name mismatch is almost always the issue, so check that before rebuilding anything. And if GA4 just looks different from every other tutorial you’ve found online, that’s completely normal. The terminology takes a few reports to click, and now you’ve got the map.