
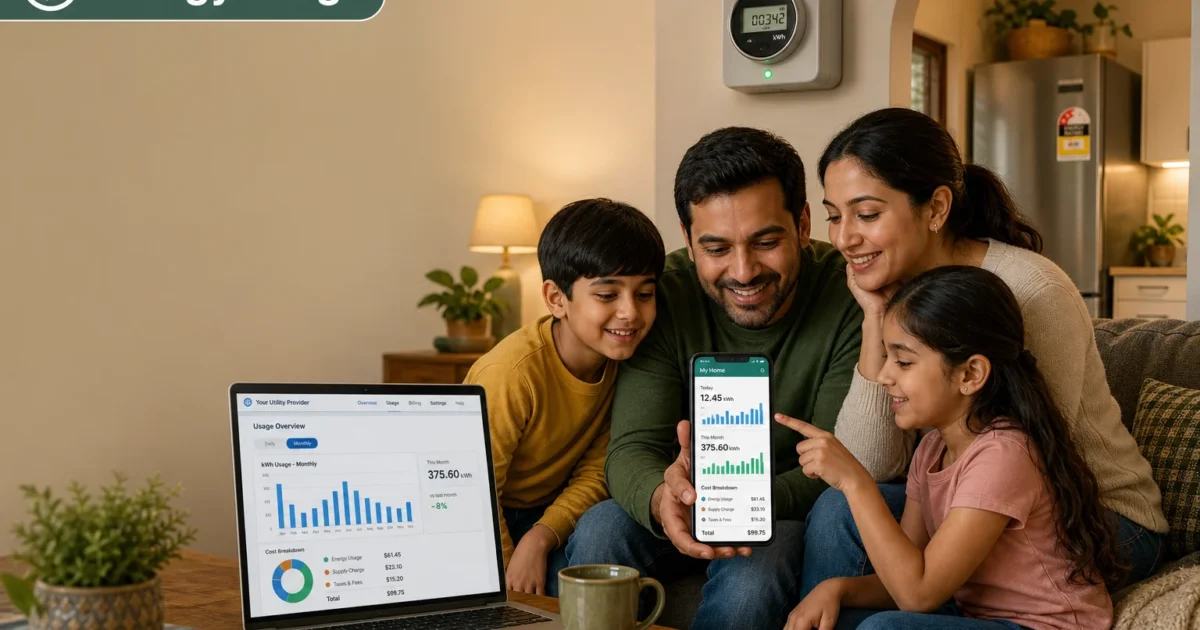
Getting your electricity bill and finding it’s jumped $40 since last month is genuinely frustrating. Something’s using a lot of power, but you just can’t figure out what. Is it the old fridge running constantly? The space heater in the spare room? The entertainment center sitting on standby around the clock?
Tracking it down has gotten a lot easier. Between your utility’s free online portal, inexpensive smart plugs, and whole-home monitors that can identify individual appliances, there’s a solid path from “why is my bill so high?” to “okay, I know what to cut.” Picking the right starting point depends on your budget and how much detail you want.
Method 1: Check Your Utility’s App or Portal First
This is the easiest place to start, and for a lot of households, it costs nothing.
Over 75% of U.S. homes already have a smart meter, which means your electricity provider is collecting detailed usage data and making it available through a web portal or mobile app. If you haven’t looked at yours yet, it’s worth five minutes.
Step 1: Log Into Your Utility Account
Go to your electricity provider’s website or open their mobile app. If you don’t have an account, register with your account number (it’s printed on your paper bill) and an email address.
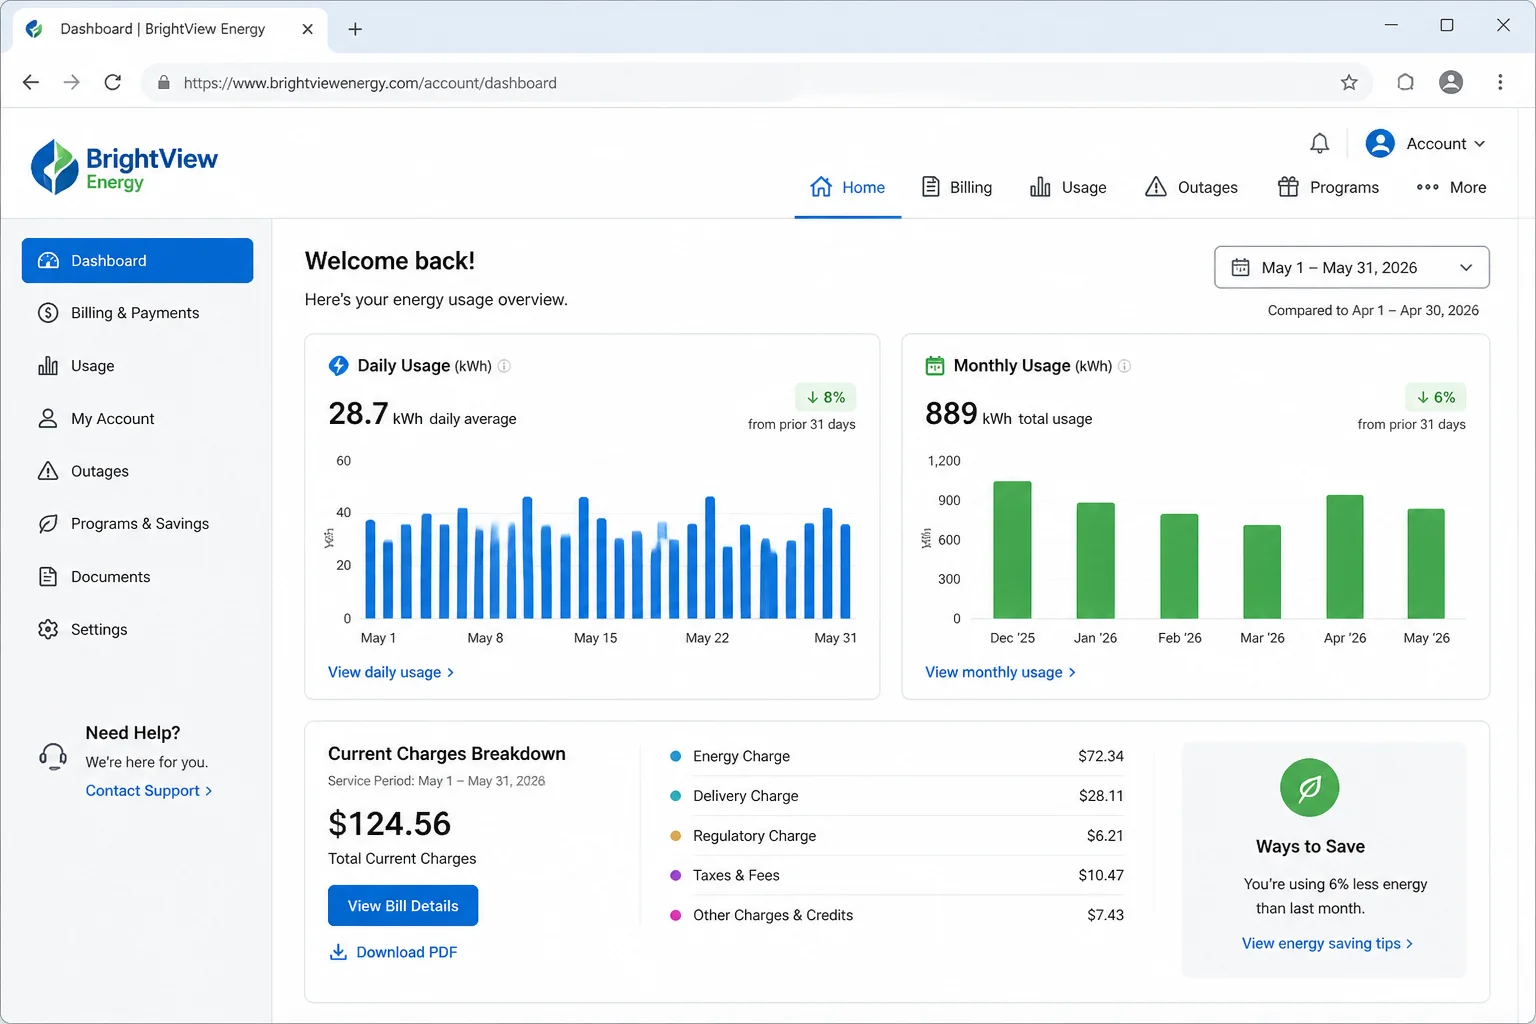
Once you’re logged in, look for a section labeled something like Usage, My Energy, Smart Meter Data, or Energy Insights. The exact label varies by provider, but it’s usually easy to find.
Step 2: Explore Your Usage Dashboard
Most utility portals now show daily, weekly, and monthly kWh usage in chart form, along with cost estimates based on your rate. Many offer 15-minute or hourly interval data too, though that’s typically delayed by a few hours.
Use the calendar controls to compare specific weeks or months. A stretch when the AC ran all day, or a cold snap when the heat barely turned off, will stand out clearly in the charts.
Step 3: Set Up Alerts
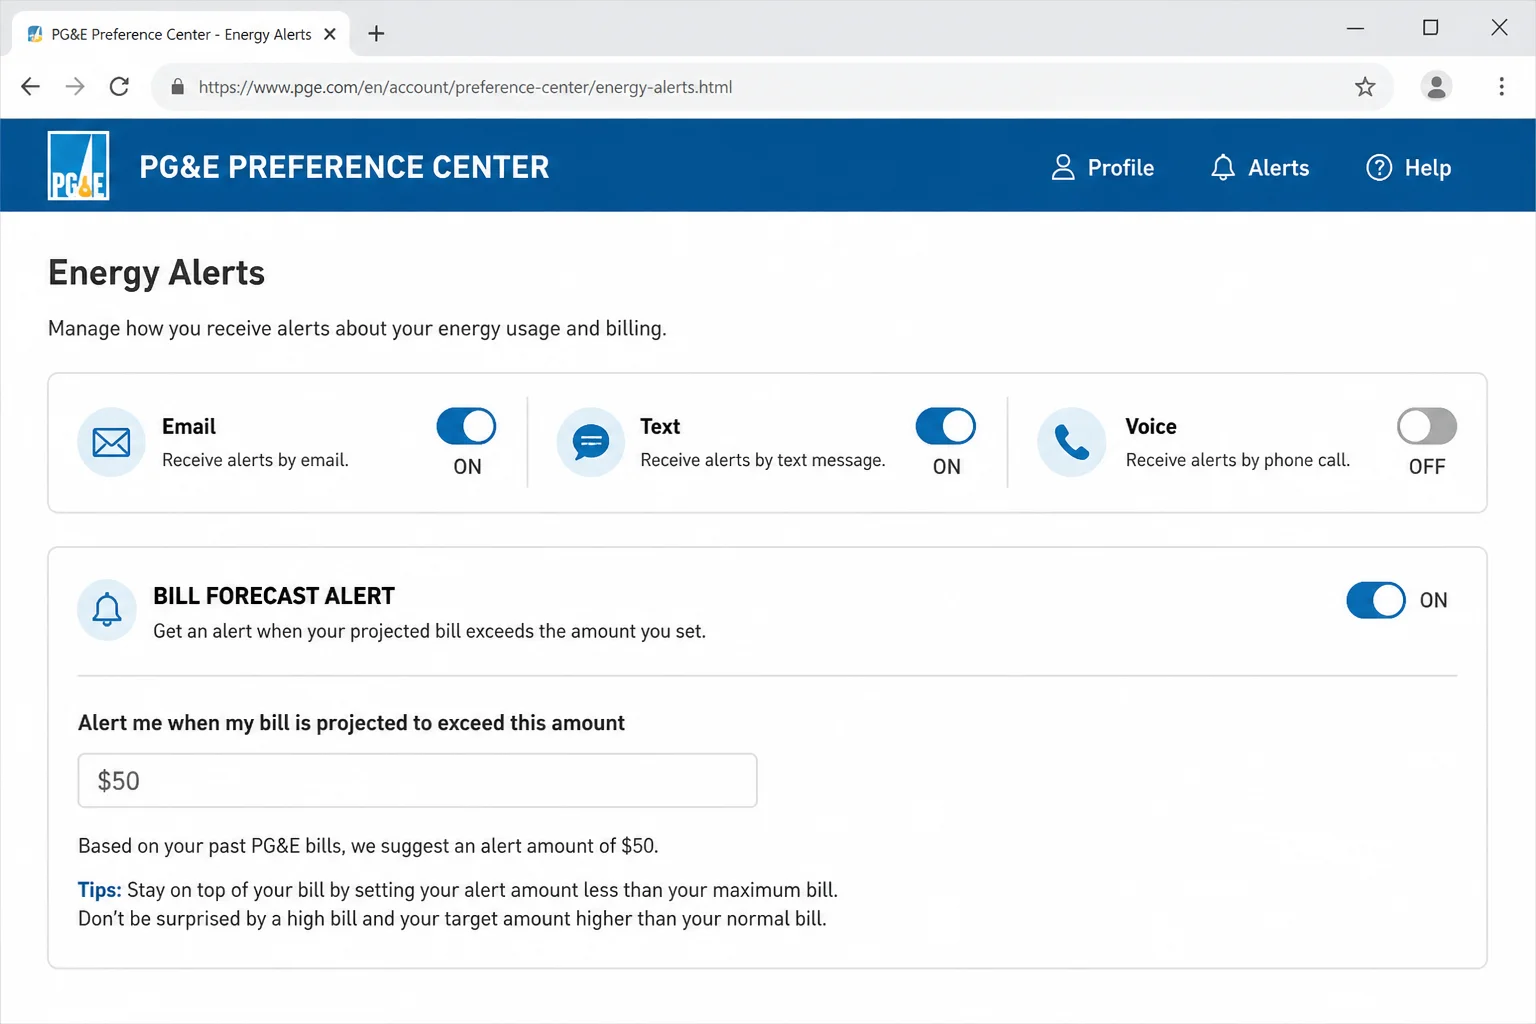
Enter your per-kWh rate so usage shows in dollars rather than just kilowatt-hours. Then set a daily kWh alert. When usage crosses your threshold, you get a notification, which can catch problems like a failing water heater or an HVAC unit working harder than it should, before the bill arrives.
The honest limitation: your utility portal is great for spotting overall patterns, but it can’t tell you which appliances are responsible. For that, you need Method 2 or Method 3.
Method 2: Smart Plugs for Per-Device Monitoring
Smart plugs with energy monitoring are probably the most practical upgrade for someone who wants appliance-level data without touching their electrical panel. You plug one into a wall outlet, plug your appliance into it, and a phone app shows exactly what that device is drawing. Simple setup, useful data.
Step 1: Choose a Plug That Tracks Energy
Not all smart plugs monitor energy usage; some are only for remote control or voice assistant automation. You want one specifically labeled with energy monitoring, showing watts and kWh. TP-Link’s Kasa line includes several options that do this, as do Emporia’s smart plugs and the Shelly Plug series. The Amazon Smart Plug doesn’t track energy usage, so check the specs before buying.
Step 2: Plug It In
Plug the monitor into a wall outlet, then plug your appliance into the monitor. Hardware done.
Step 3: Set Up the App
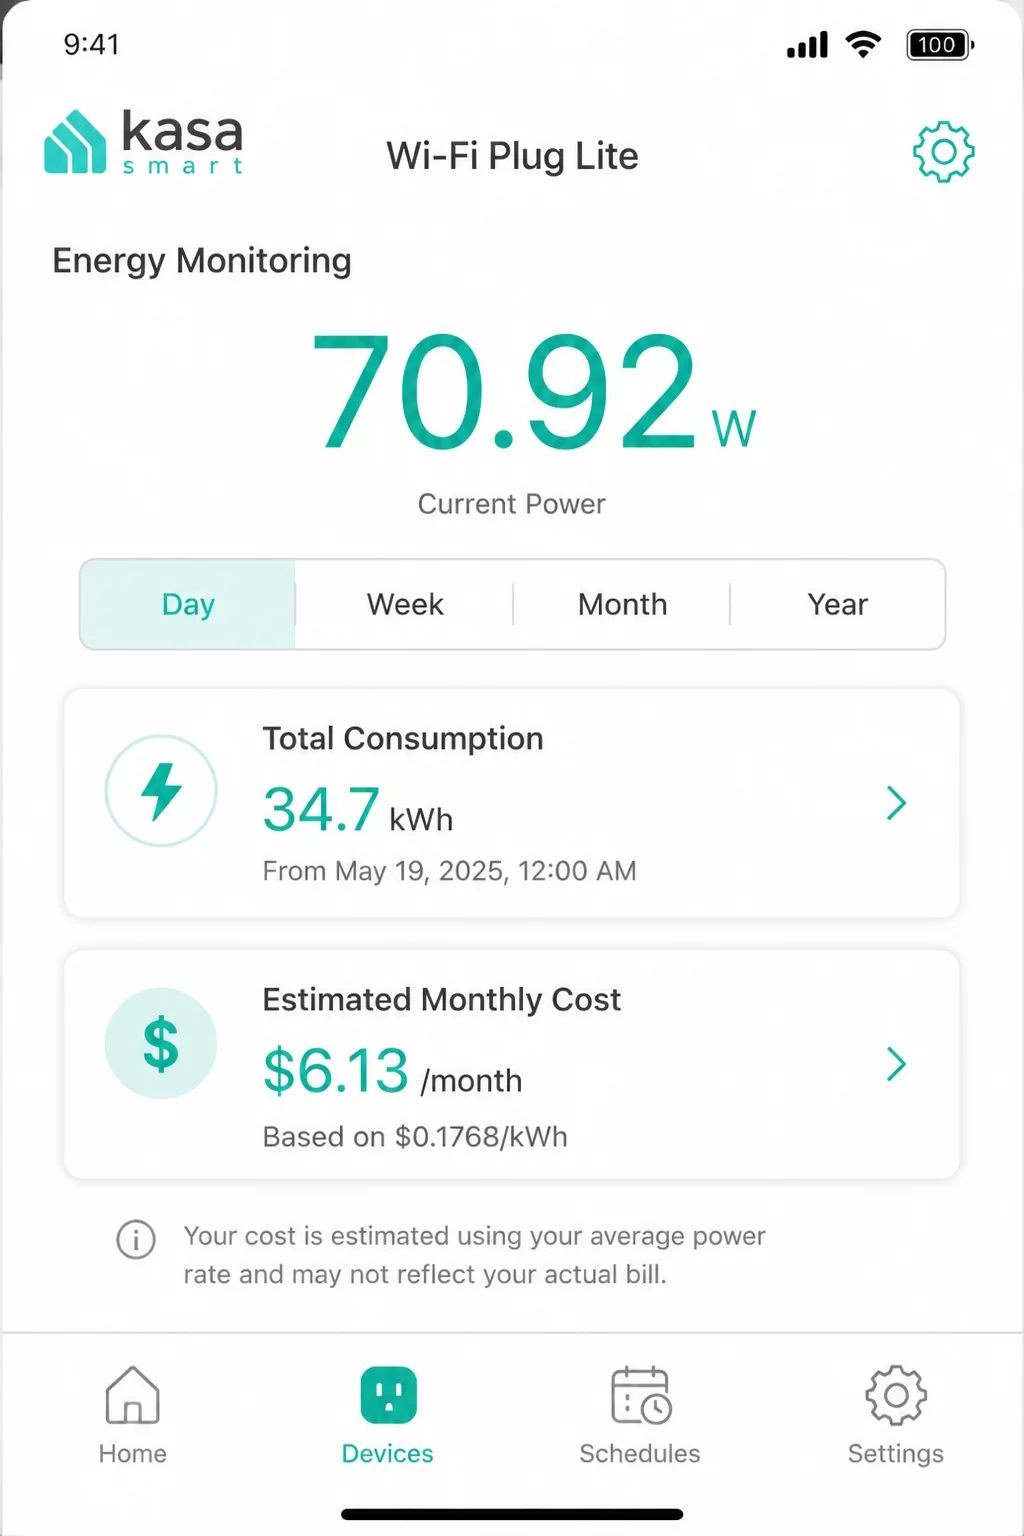
Download the manufacturer’s app (iOS or Android) and add the device. Most walk you through Wi-Fi setup in a few taps. Give the device a clear name, such as “Spare Room Heater” or “Kitchen Fridge,” so the data makes sense when you check it later.
Step 4: Read the Numbers
The app shows live wattage while the device is running, plus cumulative kWh over time. Enter your per-kWh rate and it converts everything to an estimated monthly cost. Space heaters running 8 hours a day, older fridges cycling all night, window AC units. Those numbers are worth seeing before the next bill arrives, not after.
Where smart plugs fall short: covering every outlet in your home would get expensive fast. Use them as a targeted tool for devices you already suspect are energy hogs, not as a whole-house solution.
Method 3: Whole-Home Panel Monitors (the Thorough Option)
Panel monitors are the advanced option, but they’ve become genuinely capable, and more affordable, compared to a few years back. These devices install in or near your breaker panel and track everything your home draws, all at once.
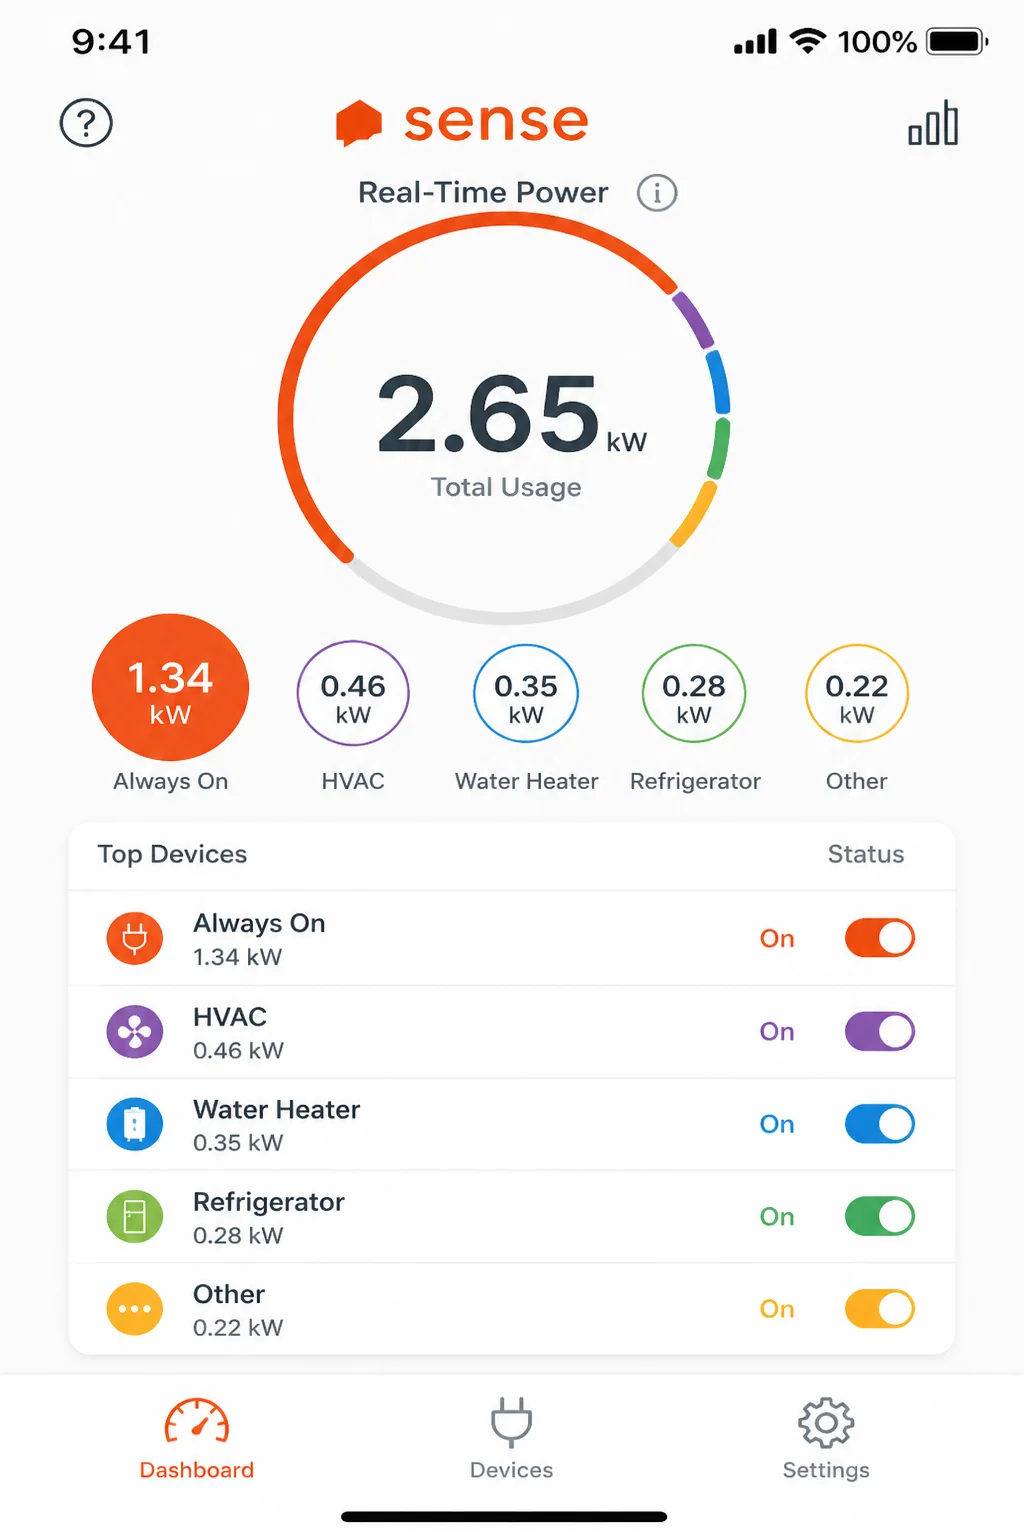
Sense is the most widely used option. It uses machine learning to identify individual appliances by their unique electrical “signatures,” sampling your home’s power many times per second. Over days and weeks, it learns to recognize your refrigerator, HVAC, washing machine, and other major devices, showing each one’s usage separately. Detection isn’t perfect. Smaller devices, or two appliances with similar draw patterns, sometimes end up in the “Other” bucket, but it gets the big loads right.
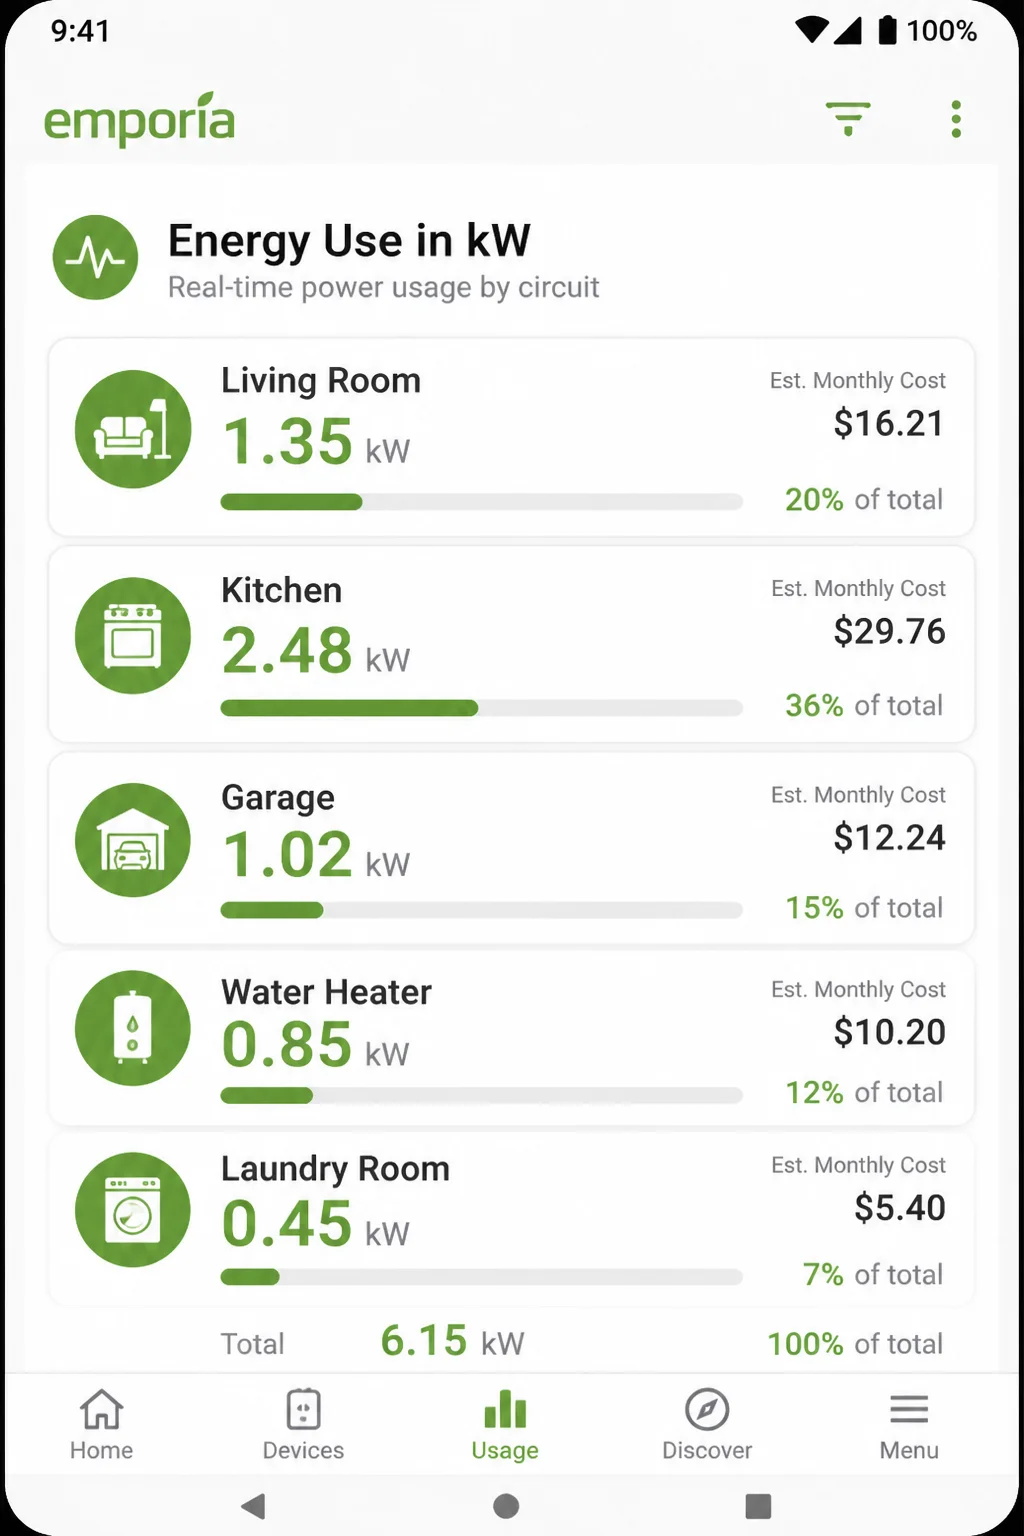
Emporia Vue Gen 2 is a budget-friendlier alternative with circuit-level monitoring. Add individual clamp sensors to specific breakers and you’ll see each circuit’s draw directly, assigned by you. No AI detection, just clear per-circuit data. Shelly 3EM and IoTaWatt are popular with home automation enthusiasts who want local data storage and more control over how readings are processed.
Hardware for solid whole-home monitoring typically starts under $200. If you’re planning to upgrade your electrical panel anyway, newer smart panels like Span include circuit-level monitoring built in, which makes a separate monitor unnecessary.
What Installation Involves
Most panel monitors include clamp-on current sensors that attach around the main service wires inside your breaker box, plus a base unit that connects to Wi-Fi. The general process:
- Turn off the appropriate breakers
- Clamp the sensors around the main feed wires
- Connect the monitor’s power leads to a spare breaker and the neutral bar
- Mount the unit inside or next to the panel
If you’re not comfortable working inside an electrical panel, that’s completely reasonable. Hire a licensed electrician. It adds to the cost, but it’s the right call.
What the Data Shows You
Once it’s running, you’ll see:
- Always-on load: what’s drawing power even when nothing seems to be on. Standby electronics, routers, aging appliances. The baseline is often surprisingly high.
- Per-circuit or per-appliance usage: exactly what each device or circuit is costing each month.
- Alerts: get notified when usage spikes or when a device turns on unexpectedly. That’s how you catch a water heater that’s quietly failing, or a phantom load you never knew existed.
AI-based systems like Sense take time to identify your appliances, so plan for a few weeks before it recognizes most of the major ones. That’s simply how the machine learning works.
Many panel monitors also integrate with Home Assistant and other smart-home platforms, which opens up automation. For example, you could cut power to non-essential circuits when your total load spikes.
Tips and Troubleshooting
Common Issues
“My utility portal only shows daily totals, not real-time data.”
That’s expected. Smart meters typically report at 15-minute or hourly intervals, and most portals add another few hours of delay on top of that. Live monitoring requires a smart plug or panel monitor. The utility portal is best for spotting patterns over days and weeks, not watching usage live.
“I can see my total usage but not which appliances are causing it.”
That’s the core limitation of utility portals and basic panel monitors without per-circuit sensors. For appliance-level data, you need smart plugs on the devices you care about, or an AI-based system like Sense. Combining both approaches gives you the most complete picture.
“The monitor keeps dropping its Wi-Fi connection.”
Panel monitors depend on Wi-Fi to sync to the cloud. If your breaker panel is far from your router, a Wi-Fi extender near the panel usually solves it. Shelly monitors paired with Home Assistant support local data storage, which sidesteps the cloud-reliability issue entirely if that’s a concern.
Pro Tips
- Start with the free stuff: Your utility’s portal costs nothing and might already show enough to make real changes without spending anything.
- Target the big draws first: Space heaters, electric water heaters, older refrigerators, and window AC units are almost always the top energy hogs. One smart plug on each tells you a lot.
- Watch your always-on baseline: If your panel monitor shows a high load even when nothing seems to be running, that’s worth digging into. Standby electronics add up faster than you’d expect.
- Combine methods: Utility data for trends, smart plugs for specific appliances, and a panel monitor for the complete breakdown.
Wrapping Up
Getting a clear picture of where your electricity is going doesn’t take much. Your utility’s app is the natural first step. It’s free, it’s already tracking your usage, and checking it takes five minutes. Add a smart plug or two for the devices you’re most curious about, and if you want the full breakdown down to the circuit level, a panel monitor like Sense or Emporia Vue is a worthwhile investment.
| Method | Best For | Typical Cost |
|---|---|---|
| Utility app or portal | Overall trends and patterns | Free |
| Smart plugs with energy monitoring | Per-appliance monitoring | ~$15–25 per plug |
| Whole-home panel monitor | Complete real-time picture | $150–200+ (hardware) |
Persistence pays off here. Track your usage for a month, identify what’s eating your bill, and make one or two changes. The next bill usually tells you exactly how much that was worth.
For more information on energy monitoring, you can visit EnergySage or HomeWizard for guides and product reviews. Additionally, Vivint offers resources on smart home energy management.